
I plugged the last missing device into my home network (yes, it was router) and was finally able to move on to the network configuration of my DIY datacenter. Unfortunately, I don't have the head to remember all these subnets and configurations, and I have no interest in creating IaC at home. So I thought to myself that I would create a network, draw it and in this way I could remind myself anytime which ports, where, to what and how are connected. Since I am not an artist, I drew a network using the power of Python.
Long story short
I plugged the last missing device into my home network (yes, it was router) and was finally able to move on to the network configuration of my DIY datacenter. Unfortunately, I don't have the head to remember all these subnets and configurations, and I have no interest in creating IaC at home. So I thought to myself that I would create a network, draw it and in this way I could remind myself anytime which ports, where, to what and how are connected. Since I am not an artist, I drew a network using the power of Python.
Modules of my choice
The choice is limited in this, let's say 'edge-case'. There are two types of Python modules to choose from. One converts the code to graphic files (jpg, png, etc.). The second category works as wrapper that allows you to open files in software dedicated to graphs. In this case yEd and draw.io editors, which are great by the way.
Overview (from IMO best to worst)
- Need To Graph (yEd Graph Editor) - The most important feature: naming ports. It's not possible to do so in draw.io module of same N2G library or in nwdiag. yEditor itself is a great tool for graphs.
- nwdiag - My first choice. The quality of created *.png files is low but damn, topology is so fine presented and .diag syntax is so clean. It was very easy to start using this module. I tested the rest of modules only, because of my curiosity, but at the end I think this module is enough for personal use.
- Need To Graph (draw.io Editor) - It looks great, but you can only name links, not ports, which limits you, because by naming link "port1 - port2" you can't be sure what device is going to be on which side.
Not tested, too much effort:
- networkx - This module was generally created for networks. It requires a lot of work if we want to use it for computer networks.
- matplotlib.pyplot - The very same issue as above, but you know the sky is the limit.
- PcapViz (yEd Graph Editor) by mateuszk87 - It's the only module which uses discovery mechanism. The script draws network based on discovered traces of levels 2 and 3.
Comparison
Setup of my network
Let's assume I have 5 network devices:
ISP <---> ONT (WAN+LAN+WiFi) <---> Switch (LAN) <---> Router / Access Point (LAN+WiFi)
To aggregate the whole network, I use a 10x1Gbit switch, which is the busiest device.
I keep everything inside a single subnet, second exists only, as a backup for HA devices (monitoring, server). The topology should be clean and easy. The case is not complicated. Let me show you the results I obtained.
The code
A quick overview of my outputs. I'm not going to replace docs of these modules, so go there in case of questions. In this "lab" I created structure like below:
Scripts:
./n2g_d_handler.py
./n2g_y_handler.py
./ndwiag_handler.py
Source and output files:
./diagrams/ndwiag.diag
./diagrams/ndwiag.png
./diagrams/output_drawio.drawio
./diagrams/output_drawio_export.png
./diagrams/output_yEd.graphml
./diagrams/output_yEd_export.png
I published my code as a gist here. Please feel free to edit and run this code for yourself.
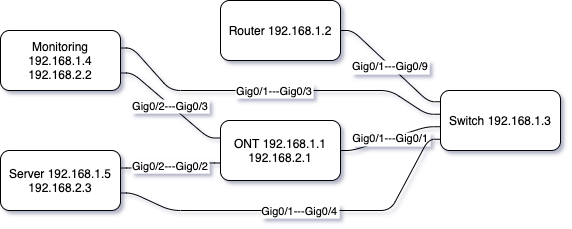
Need To Graph (yEd Graph Editor)
Great module. You can add top and bottom labels to nodes, the same with naming ports. It's possible to reorganize the placement of nodes automatically inside yEd editor.

nwdiag
In order to use ndwiag module, it's required to create a *.diag file with proper syntax. User has no impact or access to module methods and objects, so the only thing we can do is:
/
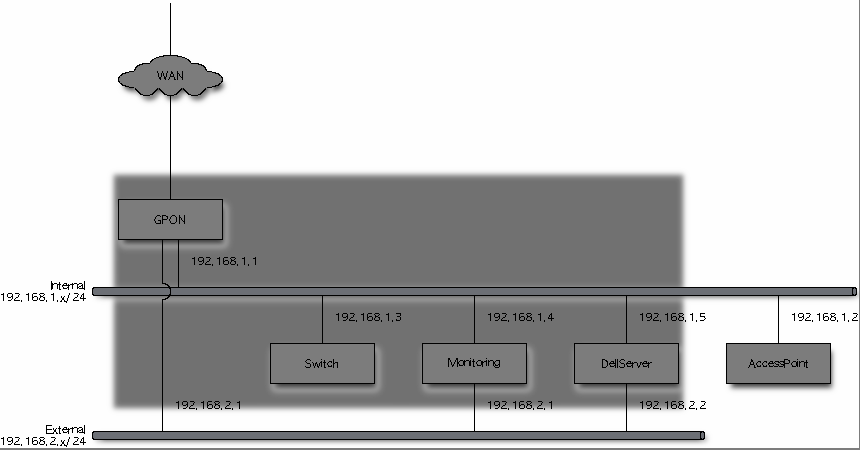
I cant find a way to tweak png compression level to have fonts so clean as in this demo. I grayed area to mark devices placed inside single rack.
Need To Graph (draw.io Editor)
As I wrote above, there is no way to name ports, so I named links after them. The created network looks better than I thought it will be.
Thanks!
Thanks for taking the time to read this post, I hope you found it interesting. If you have any questions, join my discord or write on twitter.